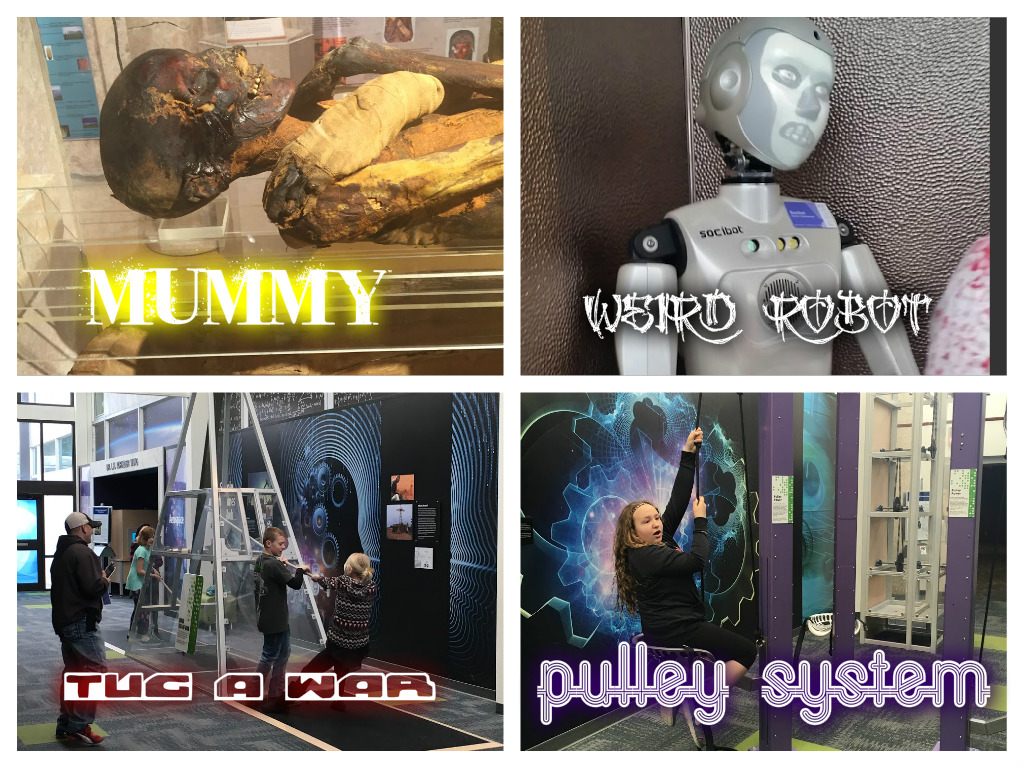
Last week in 6th grade we took a field trip to the Putnam Museum in Davenport, IA. We had a great day of experimenting and playing in the Science Center as well as getting to see the King Tut Traveling Exhibit! After our trip, the 6th graders took the pictures we all took at the museum and created a photo collage to document and remember the trip!
They did a great job and we had a blast!
Friday, April 15, 2016
Sunday, November 29, 2015
Weather and Graphing Project by 6th Grade
This project was a cross-curricular project for 6th grade students where they completed an assignment using concepts they are currently learning about in Science (Weather and Climate) and concepts they just finished learning about in Math (Graphing) by using Technology tools like Smore and Google Sheets in Tech class.
For this project, students started by using a Random Generator to spin the wheel on the Smartboard to choose what Continent they would land on. Once they knew the continent, they had to choose a city anywhere on that continent to be their focus.
The next step on the project was for them to open a shared Google Spreadsheet I started for them where they would be collecting weather data about their city for the past 10 years on their birthday and half-birthday through the website Wunderground. Through this website they were able to access Historical Weather for their city on specific dates. They collected the data on the spreadsheets. Next, they took the data collected and through Google Sheets, created a chart for each set of data. They could use any type of chart they wanted, as long as it accurately and easily displayed their data. They had to use the same type of chart for their birthday and half birthday for each of the three categories of information (Temperature, Precipitation, and Wind Speed).
Specific requirements of this project are available on this Google Document which was shared with the students.
For this project, students started by using a Random Generator to spin the wheel on the Smartboard to choose what Continent they would land on. Once they knew the continent, they had to choose a city anywhere on that continent to be their focus.
The next step on the project was for them to open a shared Google Spreadsheet I started for them where they would be collecting weather data about their city for the past 10 years on their birthday and half-birthday through the website Wunderground. Through this website they were able to access Historical Weather for their city on specific dates. They collected the data on the spreadsheets. Next, they took the data collected and through Google Sheets, created a chart for each set of data. They could use any type of chart they wanted, as long as it accurately and easily displayed their data. They had to use the same type of chart for their birthday and half birthday for each of the three categories of information (Temperature, Precipitation, and Wind Speed).
Specific requirements of this project are available on this Google Document which was shared with the students.
I made their Smore's small enough to fit on the Blog page, but it can make their projects a little difficult to see. Click anywhere on their Smore to go directly to the Smore website to view the projects.
Laura's Weather In Kabul, Afghanistan
Temperature Graph I chose a smooth double line graph because it was easy to see both the high and low temperatures at the same time. I...
|
Chris' Weather for London, UK
Subscribe to:
Posts (Atom)